Excel Dashboard कैसे बनाएं: Step-by-Step Hindi Guide
Excel Dashboard एक visual report होती है जिसमें important numbers, charts, tables और insights एक ही जगह दिखाए जाते हैं। Dashboard की मदद से business owner, freelancer, manager या student data को जल्दी समझ सकता है।
अगर आपके पास sales, expenses, attendance, inventory, orders या customer data है, तो आप Excel Dashboard बनाकर उसे professional report में बदल सकते हैं।
इस guide में हम आसान Hindi में समझेंगे कि Excel Dashboard कैसे बनाएं और dashboard बनाते समय किन बातों का ध्यान रखें।
Excel Dashboard क्या होता है?
Excel Dashboard एक ऐसी sheet होती है जिसमें data का summary visual form में दिखता है।
Example:
Total Sales
Total Profit
Total Orders
Monthly Trend
Top Products
Category-wise Sales
Pending Payments
Expense Breakdown
Dashboard का goal है कि user बिना raw data पढ़े important information quickly समझ सके।
Excel Dashboard क्यों जरूरी है?
Excel Dashboard इसलिए useful है क्योंकि यह raw data को clear insights में बदल देता है।
Benefits:
Data जल्दी समझ आता है
Decision making आसान होती है
Reports professional लगती हैं
Business performance track कर सकते हैं
Trends और problems जल्दी दिखती हैं
Client presentation बेहतर होती है
Freelancing projects में value बढ़ती है
Excel Dashboard कहां use होता है?
Excel Dashboard कई कामों में use होता है:
Sales report
Expense tracker
Budget planner
Inventory management
Attendance report
Project tracker
Customer report
Marketing report
Freelancing client reports
Business performance report
अगर आप Fiverr या Upwork पर Excel service देना चाहते हैं, तो Excel Dashboard एक high-demand skill हो सकती है।
Excel Dashboard बनाने के लिए जरूरी चीजें
Dashboard बनाने से पहले आपको कुछ basic चीजें ready रखनी चाहिए:
Clean data
Clear objective
Important KPIs
Charts
Summary tables
Proper formatting
Easy-to-read layout
Dashboard तभी अच्छा बनेगा जब आपका data clean और organized होगा।
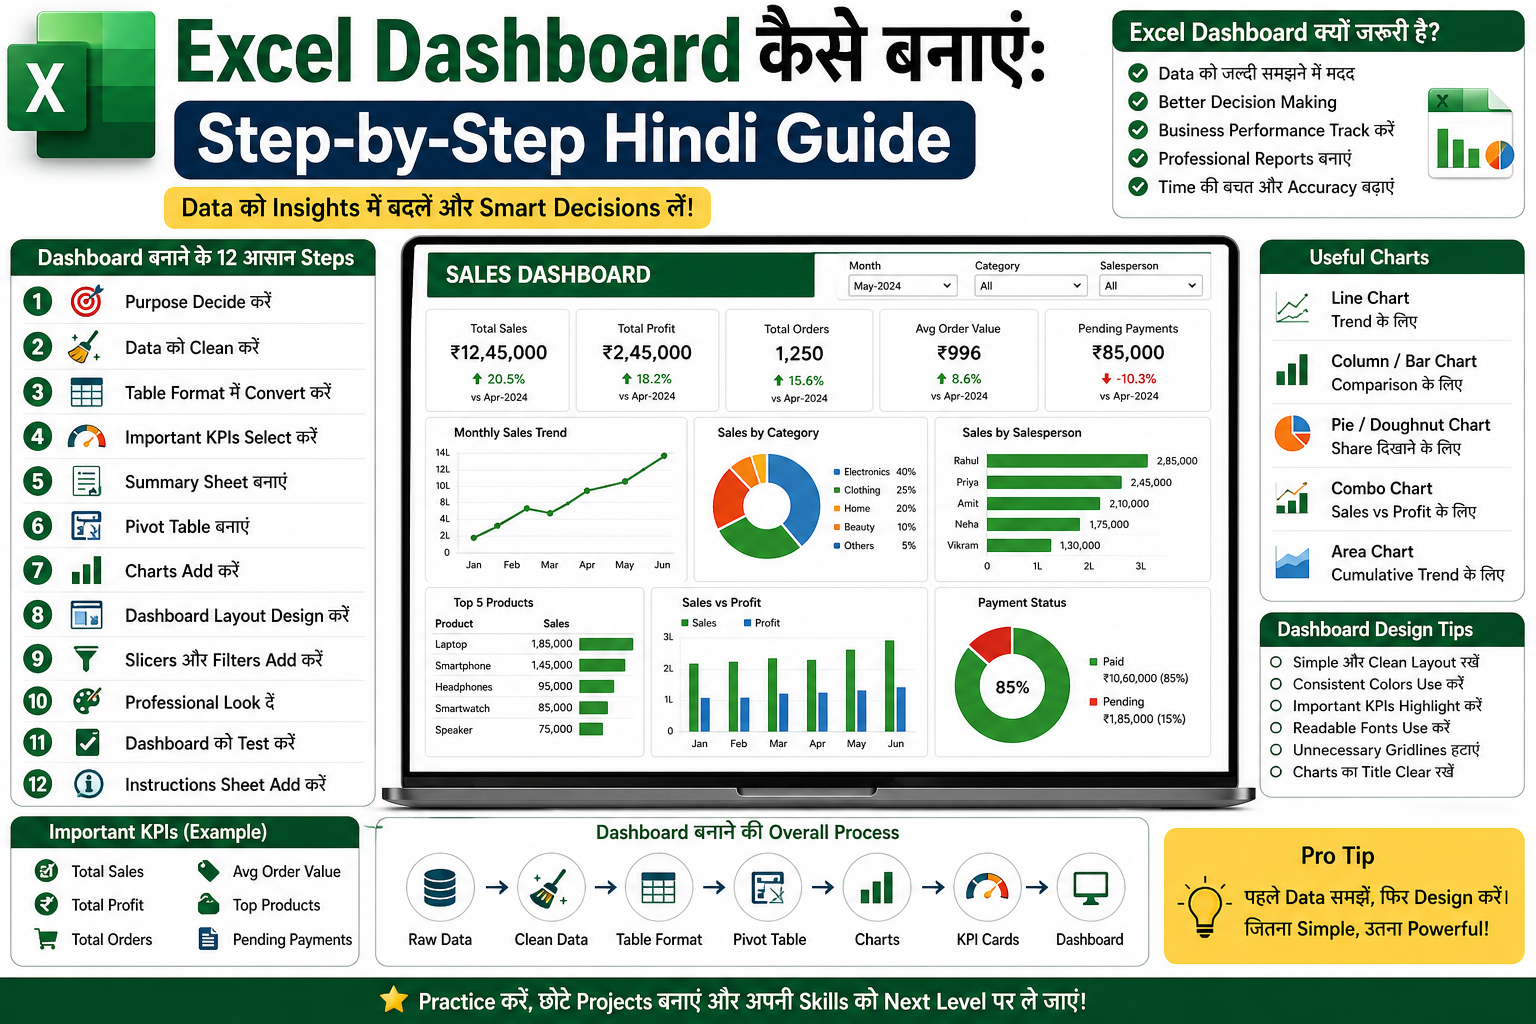
Step 1: Dashboard का Purpose Decide करें
सबसे पहले यह decide करें कि dashboard किस purpose के लिए बन रहा है।
Example:
Sales dashboard
Expense dashboard
Attendance dashboard
Inventory dashboard
Project dashboard
अगर purpose clear नहीं होगा, तो dashboard confusing बन सकता है।
Example:
अगर आप sales dashboard बना रहे हैं, तो dashboard का goal हो सकता है:
Total sales देखना
Monthly sales trend समझना
Top products identify करना
Salesperson performance compare करना
Profit analysis करना
Step 2: Data को Clean करें
Dashboard बनाने से पहले raw data clean करना बहुत जरूरी है।
Check करें:
Empty rows न हों
Duplicate records न हों
Wrong date format न हो
Extra spaces न हों
Amount सही number format में हो
Column names clear हों
Spelling consistent हो
Example:
अगर Payment Status में कहीं Paid, कहीं paid, कहीं PAID लिखा है, तो report गलत बन सकती है। इसलिए values consistent रखें।
Useful formulas:
TRIM formula extra spaces remove करने के लिए:
=TRIM(A2)
Duplicate check करने के लिए COUNTIF use कर सकते हैं:
=COUNTIF(A:A,A2)>1
Step 3: Data को Table Format में Convert करें
Excel में data को table format में convert करना dashboard के लिए बहुत useful है।
Steps:
Raw data select करें
Ctrl + T press करें
My table has headers select करें
OK करें
Table format के फायदे:
New data add करने पर range automatically expand होती है
Formulas easy हो जाते हैं
Pivot table के लिए अच्छा structure मिलता है
Data clean और readable रहता है
Step 4: Important KPIs Select करें
KPI का मतलब है Key Performance Indicator. ये dashboard के सबसे important numbers होते हैं।
Sales Dashboard के KPIs:
Total Sales
Total Profit
Total Orders
Average Order Value
Top Product
Pending Payment
Monthly Growth
Expense Dashboard के KPIs:
Total Expense
Highest Expense Category
Monthly Budget
Budget Used
Remaining Balance
Savings
Inventory Dashboard के KPIs:
Total Products
Low Stock Items
Total Stock Value
Fast Moving Products
Out of Stock Items
Dashboard में बहुत ज्यादा KPIs न डालें। सिर्फ important KPIs रखें।
Step 5: Summary Sheet बनाएं
Raw data से direct dashboard न बनाएं। पहले एक summary sheet बनाएं।
Workbook structure:
Raw Data
Summary
Dashboard
Summary sheet में formulas, pivot tables और calculated values रखें।
इससे dashboard clean रहता है और formulas manage करना आसान होता है।
Step 6: Pivot Table बनाएं
Pivot Table dashboard बनाने के लिए बहुत powerful tool है।
Pivot table से आप quickly summary बना सकते हैं:
Month-wise sales
Product-wise sales
Category-wise expense
Salesperson performance
Region-wise report
Steps:
Data table select करें
Insert → PivotTable
New worksheet select करें
Fields drag and drop करें
Rows, Columns और Values set करें
Example:
Month-wise Sales Pivot:
Rows: Month
Values: Sales Amount
Product-wise Sales Pivot:
Rows: Product Name
Values: Sales Amount
Step 7: Charts Add करें
Dashboard में charts data को visual बनाते हैं।
Common charts:
Line Chart
Bar Chart
Column Chart
Pie Chart
Doughnut Chart
Area Chart
Combo Chart
कौन सा chart कब use करें?
Monthly trend के लिए Line Chart
Product comparison के लिए Bar Chart
Category share के लिए Pie/Doughnut Chart
Sales vs Profit के लिए Combo Chart
Region-wise comparison के लिए Column Chart
Charts simple और readable रखें। बहुत ज्यादा colors use न करें।
Step 8: Dashboard Layout Design करें
Dashboard layout बहुत important है। Good layout से dashboard professional लगता है।
Recommended layout:
Top section: KPIs
Middle section: Main charts
Bottom section: details/table
Side section: filters/slicers
Example layout:
Top row:
Total Sales, Total Profit, Total Orders, Average Order Value
Middle:
Monthly Sales Trend, Sales by Category
Bottom:
Top Products, Salesperson Performance
Step 9: Slicers और Filters Add करें
Slicers dashboard को interactive बनाते हैं।
Slicers से user filter कर सकता है:
Month
Year
Product
Category
Region
Salesperson
Status
Steps:
Pivot table select करें
Insert → Slicer
Field select करें
OK करें
Slicers को dashboard में neatly place करें।
Step 10: Dashboard को Professional Look दें
Dashboard design simple और clean रखें।
Design tips:
Consistent colors use करें
Font readable रखें
Unnecessary gridlines remove करें
Charts के titles clear रखें
KPIs को cards की तरह show करें
Spacing proper रखें
Too much text avoid करें
Important numbers bold रखें
Professional dashboard में clarity सबसे important होती है।
Step 11: Dashboard को Test करें
Dashboard बनाने के बाद test जरूर करें।
Check करें:
New data add करने पर update हो रहा है या नहीं
Formulas सही result दे रहे हैं या नहीं
Charts correct data दिखा रहे हैं या नहीं
Filters work कर रहे हैं या नहीं
No broken formula
No wrong totals
Date format correct
अगर dashboard client को देना है, तो final check बहुत जरूरी है।
Step 12: Instructions Sheet Add करें
अगर आप dashboard client को deliver कर रहे हैं, तो एक instruction sheet add करें।
Instruction sheet में लिखें:
Data कहां enter करना है
Dashboard कैसे refresh करना है
Filters कैसे use करने हैं
कौन से cells edit नहीं करने हैं
File का purpose क्या है
इससे client को file use करना आसान हो जाता है।
Excel Dashboard के लिए Useful Formulas
Dashboard में ये formulas बहुत useful होते हैं:
SUM
Total निकालने के लिए:
=SUM(B2:B100)
SUMIF
Condition के base पर total:
=SUMIF(A2:A100,"Sales",B2:B100)
COUNTIF
Condition count करने के लिए:
=COUNTIF(C2:C100,"Paid")
AVERAGE
Average निकालने के लिए:
=AVERAGE(B2:B100)
IF
Condition based result:
=IF(B2>10000,"High","Low")
XLOOKUP
Data lookup करने के लिए:
=XLOOKUP(E2,A2:A100,B2:B100)
TEXT
Date/month format करने के लिए:
=TEXT(A2,"mmm-yyyy")
Excel Dashboard में कौन-कौन से Charts होने चाहिए?
Dashboard के purpose पर depend करता है, लेकिन common charts ये हैं:
Monthly trend chart
Category-wise chart
Top 5 products chart
Salesperson performance chart
Profit comparison chart
Expense breakdown chart
Status summary chart
Dashboard में बहुत ज्यादा charts न डालें। 3–5 strong charts काफी होते हैं।
Excel Dashboard बनाते समय Common Mistakes
Beginners ये mistakes करते हैं:
Raw data clean नहीं करते
बहुत ज्यादा colors use करते हैं
Too many charts डालते हैं
KPI cards missing रखते हैं
Formula test नहीं करते
Dashboard को cluttered बना देते हैं
Slicers गलत data से connect करते हैं
Instructions sheet नहीं जोड़ते
Client requirement clear नहीं लेते
इन mistakes से बचेंगे तो dashboard professional लगेगा।
Freelancers के लिए Excel Dashboard Tips
अगर आप Fiverr या Upwork पर Excel Dashboard service देना चाहते हैं, तो इन tips को follow करें:
Client से requirement clear लें
Sample dashboard दिखाएं
Data structure पहले समझें
Delivery से पहले formulas test करें
Dashboard design clean रखें
Instruction sheet add करें
Revision policy clear रखें
Professional delivery message भेजें
Client से पूछने वाले questions:
Dashboard किस purpose के लिए चाहिए?
Data source क्या है?
कौन-कौन से KPIs चाहिए?
कौन से charts चाहिए?
Filters चाहिए या नहीं?
File Excel में चाहिए या Google Sheets में?
Deadline क्या है?
AI से Excel Dashboard कैसे Plan करें?
AI tools जैसे ChatGPT dashboard planning में help कर सकते हैं।
आप AI से पूछ सकते हैं:
मुझे sales dashboard बनाना है। कौन-कौन से KPIs और charts होने चाहिए?
या:
मेरे पास Date, Product, Category, Sales, Profit columns हैं। इस data के लिए Excel dashboard layout suggest करो।
AI आपको layout, formulas, charts और report structure suggest कर सकता है। लेकिन final dashboard आपको Excel में manually बनाना और test करना चाहिए।
Beginner Practice Project
Practice के लिए एक simple sales dashboard बनाएं।
Data columns:
Date
Product
Category
Quantity
Price
Sales
Profit
Salesperson
Dashboard में add करें:
Total Sales
Total Profit
Total Orders
Monthly Sales Trend
Top 5 Products
Category-wise Sales
Salesperson Performance
Month Slicer
यह project portfolio में भी add किया जा सकता है।
Excel Dashboard से पैसे कैसे कमाएं?
Excel Dashboard skill से आप freelancing और digital products दोनों में earning कर सकते हैं।
Freelancing services:
Sales dashboard
Expense dashboard
Inventory dashboard
Attendance dashboard
Project dashboard
Business report dashboard
Digital products:
Budget dashboard template
Sales dashboard template
Expense tracker dashboard
Inventory management dashboard
Business KPI dashboard
आप इन्हें Fiverr, Upwork, Gumroad, Etsy या अपनी website पर sell कर सकते हैं।
Beginner Action Plan
Day 1:
Raw data और table format सीखें
Day 2:
Basic formulas practice करें
Day 3:
Pivot table बनाना सीखें
Day 4:
Charts बनाएं
Day 5:
KPI cards design करें
Day 6:
Slicers और filters add करें
Day 7:
एक complete sales dashboard बनाएं
Day 8:
Portfolio screenshot तैयार करें
Day 9:
Fiverr gig या website service page बनाएं
Day 10:
Sample dashboard को promote करें
Conclusion
Excel Dashboard बनाना एक practical और valuable skill है। इससे आप raw data को professional visual report में बदल सकते हैं।
Dashboard बनाने के लिए आपको data cleaning, KPIs, pivot tables, charts, slicers और clean design पर ध्यान देना चाहिए।
अगर आप beginner हैं, तो पहले simple sales dashboard से शुरुआत करें। धीरे-धीरे advanced dashboards बनाना सीखें।
Excel Dashboard skill freelancing, job और digital product selling के लिए बहुत useful है। अगर आप Excel, AI और freelancing skills practical तरीके से सीखना चाहते हैं, तो Viznova पर आपको guides, templates और live sessions मिलेंगे।
Your Comments & Ratings
No comments yet. Be the first to share your thoughts.